Metasploit Reporting,
Already on the Timeline
Stream Metasploit module runs, sessions, credentials, and loot into your engagement timeline. Metasploit reporting with the evidence already in place when testing ends.
Just Test. The Timeline Writes Itself.
Metasploit knows exactly what you exploited and when. Your report only knows what you remembered to copy out of msfconsole before the workspace was wiped. The Metasploit collector keeps the two in step.
The collector connects to the Metasploit RPC service and streams it into the engagement. Every module run, every session opened, every credential, and every piece of loot lands on the timeline with the operator and the time it happened.
The session that proved the vulnerability is one click from a finding, with its output attached as evidence.
$ neuron collector metasploit --ssh attack \ --msf-url https://127.0.0.1:55553/api/ Tunnelling to attack over SSH✓ Streaming Metasploit to Acme Internal Q4 $ neuron collector list metasploit running Acme Internal Q4- 15:12 Metasploit Loot: hashdump from SQL-01
- 15:09 Metasploit Meterpreter session 3 on SQL-01
- 15:08 Metasploit Module: exploit/windows/mssql/mssql_payload
- 14:51 Import Nmap: 41 hosts, 187 ports
Why Metasploit Reporting Takes So Long
Metasploit's database is excellent at tracking hosts and sessions inside one workspace. It is not a report. Getting from msfconsole to a client deliverable means db_export, spooled console logs, and screenshots of the session that proved the exploit.
On a shared engagement it is worse. Each tester has their own msfconsole, their own workspace, and their own idea of which session came from which module. Nobody has the full picture until someone merges it by hand.
And the evidence lives on a box that gets rebuilt for the next engagement.
Everything Metasploit Produces, On the Engagement
The Metasploit collector streams the moment each event happens, for as long as it runs.
Module Runs
Every exploit, auxiliary, and post module run, with its target and options, so the record shows exactly what was attempted.
Sessions
Each Meterpreter or shell session as it opens, with the target host, session type, and the module that opened it.
Credentials
Credentials gathered into the Metasploit database, recorded on the engagement and ready to tie to findings.
Loot
Hashes, files, and configuration pulled from target hosts, kept with the engagement as evidence.
Operator Attribution
Every event carries the tester who caused it, even when several people share the same RPC service.
Exploits Next to Scans
The Nmap import that found the service and the module that exploited it sit a few rows apart, so the finding carries its discovery and its proof.
How to Log Metasploit to Your Engagement
- 01
Start the Metasploit RPC service
Run msfrpcd on the box you attack from, bound to localhost. The collector authenticates with an RPC token passed as --msf-token or the MSF_RPC_TOKEN environment variable.
$ msfrpcd -U neuron -P <password> -a 127.0.0.1 - 02
Or load it into a running console
Already deep in an msfconsole session? Load msgrpc inside it instead and keep your workspace, jobs, and sessions exactly where they are.
$ load msgrpc ServerHost=127.0.0.1 Pass=<password> - 03
Start the collector
Point it at the RPC endpoint. When the service only listens on the attack box, add --ssh and the collector tunnels over your own SSH.
$ neuron collector metasploit --ssh attack --msf-url https://127.0.0.1:55553/api/ - 04
Exploit as normal
Work in msfconsole exactly as you always do. neuron collector stop ends the collector when the engagement closes.
$ neuron collector stop metasploit
Your Infrastructure. Your Data.
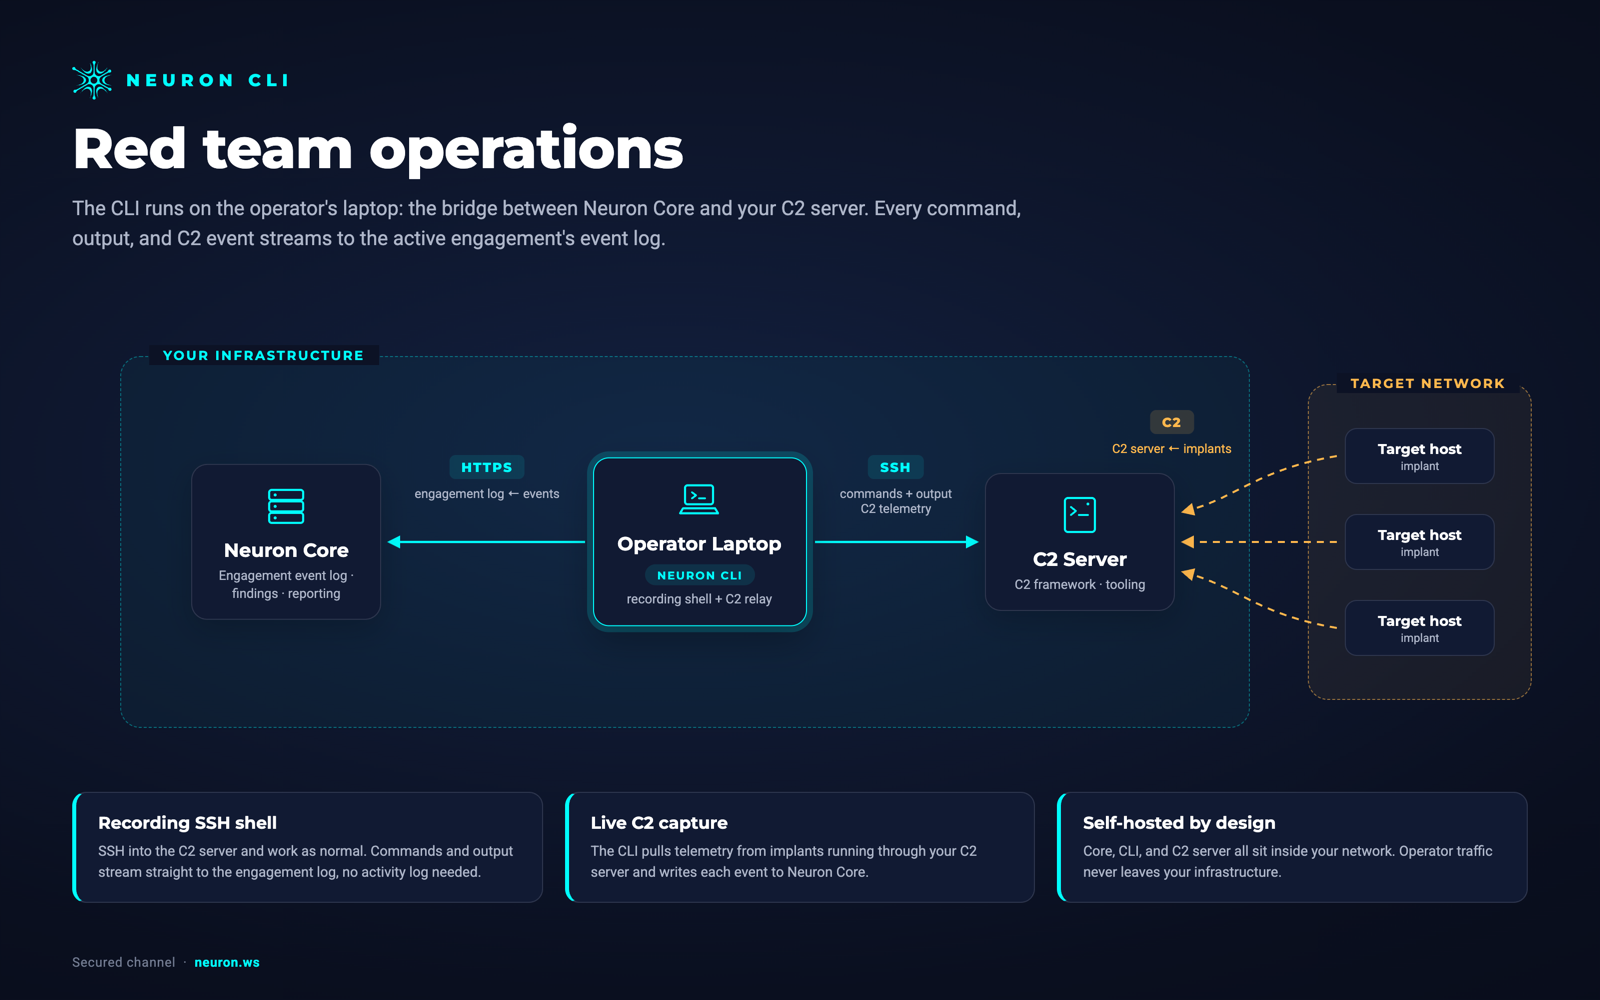
The CLI runs on the operator's laptop, the bridge between Neuron and your C2 server. Neuron, the CLI, and Metasploit all sit inside your network. Nothing is routed through a third-party cloud.
Metasploit needs the Red Team module on your Neuron server.
From Metasploitto the Final Report
The session that proved the vulnerability is already on the timeline with the module that opened it. Promote it straight into a finding with its output attached, and the credentials and loot that back it are already on the engagement.
Because Metasploit events sit next to your imported scans, the finding links to the host and service it was found on without anyone retyping an IP address.
For the retest, rerun the same module in the retest round. A session that opens is proof the fix failed, and a module that fails against the patched host is proof it worked, both timestamped in the record.
Metasploit Integration FAQ
The questions teams ask most about Metasploit and Neuron.
How do I get Metasploit results into a pentest report?
Run the Neuron CLI Metasploit collector during the engagement. It streams module runs, sessions, credentials, and loot into the engagement timeline as they happen, so the evidence is in place when you write the finding instead of exported from a workspace afterwards.
How does the collector connect to Metasploit?
Through the Metasploit RPC service, started with msfrpcd or by loading msgrpc in msfconsole. Pass the endpoint with --msf-url and the token with --msf-token or MSF_RPC_TOKEN.
Can I keep the RPC service bound to localhost?
Yes, and you should. Add --ssh and the host, and the CLI forwards the RPC endpoint over your own ssh, so the service never has to listen on a routable address.
Does it work when several testers share one Metasploit instance?
Yes. Every event keeps the tester who caused it, so a shared RPC service still produces an accurate, attributed timeline.
Do I have to restart msfconsole to use the collector?
No. Load msgrpc into the console you already have open and point the collector at it. Your workspace, running jobs, and open sessions stay as they are.
More Neuron Integrations
Mythic C2 Reporting and Activity Logging
C2 FrameworksSliver C2 Reporting and Activity Logging
C2 FrameworksGoPhish Reporting and Campaign Tracking
PhishingEvilginx Reporting and Session Capture Logging
PhishingNetExec (nxc) Reporting and Logging
Active DirectoryCertipy AD CS Reporting and ESC Findings
Active DirectoryBloodHound Reporting and Attack Path Import
Active DirectoryNmap Reporting: Nmap XML to Pentest Report
Network DiscoveryReady to Transform Your Security Practice?
See how Neuron helps security teams replace fragmented tools with a single platform for offensive security, bringing structure, visibility, and consistency to every engagement.
Platform